As inbound marketers, we are faced with long lists of to-do's, bombarded with distractions and tasked with the all important strategy for revenue growth. Keeping an eye on the goal is important and developing reporting routines within your originization is paramount to your success. Here are 10 reports that will help you keep track of the right data and metrics.
Before starting, the first step is to:
Set SMART (Specific, Measurable, Attainable, Realistic, Timeline) Goals
Many have heard and understand the SMART acronym but most don't actually document and refer back to it. For the purpose of this article, let's go through the motions and actually set some SMART goals. Feel free to pause and get a sheet paper for this exercise or load up a page in Evernote, like we do @rizeninbound.
Specific: I want to double the amount of paying monthly subscribers for my unique and valuable SAAS software from 150 to 300 per month over 1 year.
Measurable: The amount to increase my subscriber base is 150 over 12 months incrementally.
Attainable: Doubling clients in a year is feasible because our software solution is unique, valuable and based on a survey we conducted to our target market where 70% would consider our software a valuable tool for their busienss.
Realistic: It is realistic that we double the number of subscribers due to the total number of keywords and volume that we are not ranking for which we expect to using Inbound practices.
Timely: Using the Inbound methedology I will reach my goal in 1 year.
Determine the questions your data should answer
Data is just information and we as marketers need to interpret how we are going to use this information to answer a specific question. For example, "How many people are engaging with my email newsletter?" For this question, the metrics you would analyze are open rates, bounce rates, and conversion rates (people completing the desired action, usually clicking a link at the end). Another possible question is, "How effective is my Pay Per Click landing page?" The specific metrics we would look at to determine the effectiveness of our landing page would be bounce rate, conversion rate, and time on page.
Identify the key metrics to track
Depending on whether your in the Attract, Convert or Close phase of the buyer's journey (more detail on this later), you will need to identify what your going to report on and what metrics you need to analyze to answer your specific question. There are several metrics to analyze depending on your question. You can get very detailed with metrics such as what mobile device your prospects are viewing your site on, to more high level metrics like unique visitors, leads, qualified leads, new customers, revenue and more. Once you have decided on two or more reports, the next step it to:
Develop a routine
In your calendar, set a mid-month and end-of-month repeating event for at least 15 - 30 minutes to go over the reporting and discuss how the SMART goal is being affected. Are the numbers improving, stagnant or decreasing? Some things need to be tracked weekly or even daily and that will vary, but ensure you develop a habit or routine.
Attract (You Want More Visitor Traffic!) Level Reporting
If you want to bring more people to your website, you're in the Attract phase of the Inbound Methodology.
1. Sources Reporting
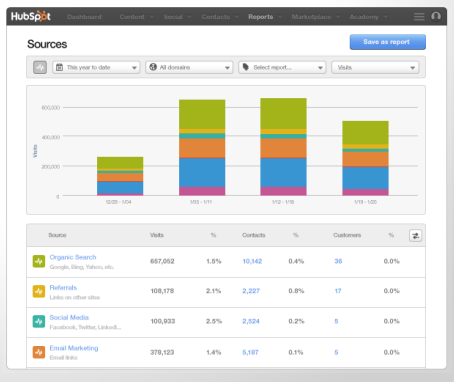
This report will help you understand where you should invest resources and how your sources are performing. Sources to identify and review are: Organic Traffic, Email Marketing, Social Traffic, Pay Per Click, Referral Traffic and Direct Traffic, Other Campaigns, Offline Sources. You can report this as visitors increase/decrease month over month.
2. Visits to Contacts
This report will help you understand which sources are generating contacts (or leads) by channel. It also identifies what source is giving you the most leads. For example, social media, specifically LinkedIn, may send a lot of leads, so you'll probably want to give LinkedIn special attention.

Convert (You Want More Leads!) Level Reporting
Your doing a great job at getting visitors to your website but you want to analyze reports that will help measure the effectiveness of this traffic in the convert phase.
3. Blog Leads by Source
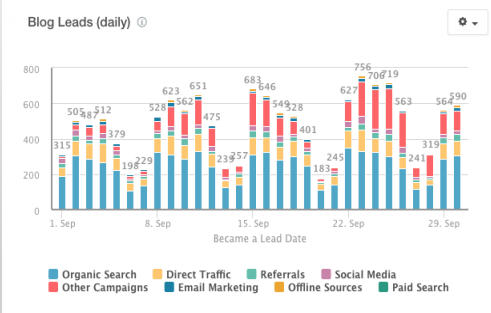
This will help you understand what channels are the best for generating leads from your blog. In the case of a SAAS blog for a software that helps marketers, it stands to reason that LinkedIn might be a better place to share your content versus Twitter. Not to say we shouldn't be sharing on Twitter, but if LinkedIn is the best for social lead generation in terms of results for your blog posts, then it's worth looking further into it and maximizing it, say by boosting that blog post with LinkedIn PPC.
4. Number of Contacts
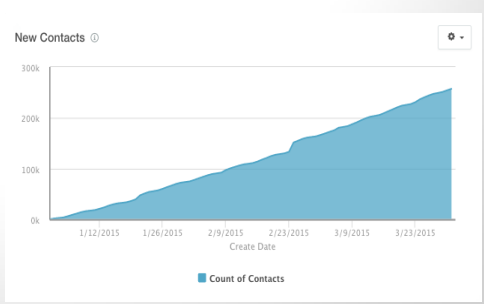
This shows the number of new contacts you are generating over a period of time. You want to look at this number throughout the month and, at minimum, mid-month and end of month to see if your reaching your goals (remember the goal was to get 300 monthly subscribers).
5. Contact Lifecycle Funnel
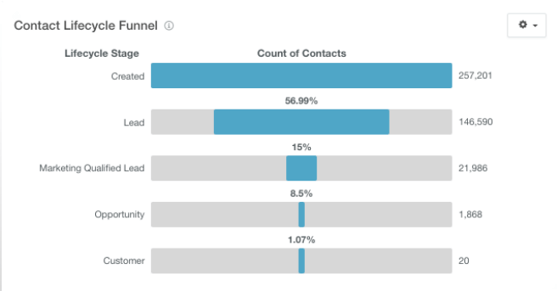
This reporting will help you identify how your contacts move through the different lifecycle stages. Understanding this process and visualizing this information will help you identify strengths and weaknesses in your funnel. This data can help you adjust your content to increase your customer base.
6. Contacts by Conversion
This type of reporting will help you identify the types of content that are helping generate leads as well as topics your audience are most interested in. Depending on your performance, you'll use the opportunity to review your Buyer Persona's and Buyers Journey's and determine if you need to adjust your content.
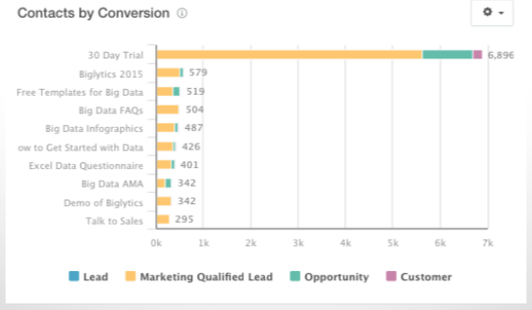
Clearly the Free Trial is a big deal with SaaS companies. It makes sense, as people want to try something out before they commit to being charged on a monthly basis; usually the model of most SaaS businesses but not all.
7. Number of MQL’s (Marketing Qualified Leads)
This report will help you identify people who came to your site and did more than just read an article or skimmed through some pages. They signed up for a trial, downloaded a whitepaper, or registered for a live webinar. Those are people who are truly interested and are usually good leads because they were willing to give up personal information for something you had to offer.
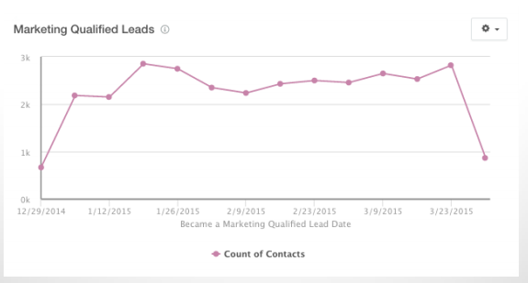
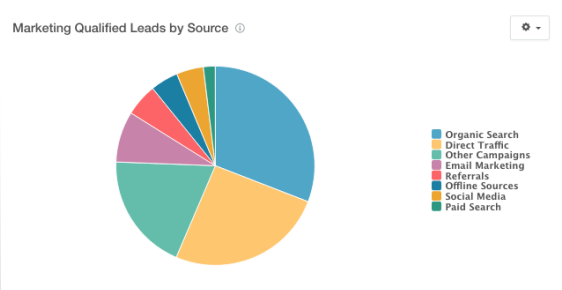
8. MQL’s (Marketing Qualified Leads a.k.a. Good Leads) by Source
This reporting will help identify what types of content are generating marketing qualified leads as well as the topics your audience is most interested in by source. You can use this information once again to adjust your content and optimize lead sources to improve them.
Close Level (I Want More Sales!) Reporting
The last phase of reporting is Close Level Reporting. Close Level Reporting helps determine the effectiveness in the close phase and assumes your closing the loop in reporting (either through integration or manually entering your close dates for each contact/lead).
So now that you're getting traffic and leads, how are you doing at closing these deals?
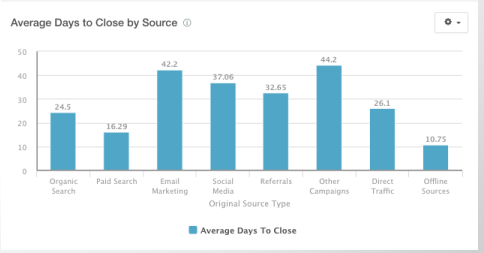
9. Average Days to Close
This report will help you identify how long it takes to close customers from each source. You can use this information to identify the sources that attract leads who are likely to close as well as identify at-risk opportunities.
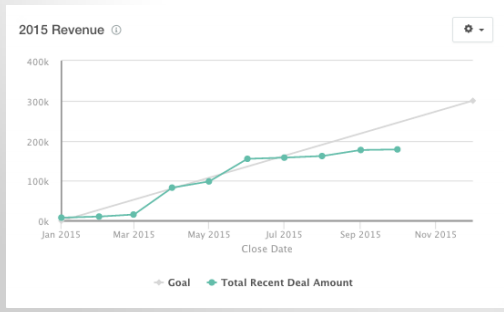
10. Revenue Reporting
This will help by tracking how much money your company is generating each month and gives you a big-picture overview of where your going with your goals.
It's important that as marketers we always keep our SMART goals in mind because there will be distractions and obstacles along our marketing journey. Having fixed days and times for reporting helps keep the business paying attention to the tasks that matter as it relates to the reporting data. For example, if the company is not generating many leads for a specific quarter, this type of reporting will help you identify trends to help fix the problem. In the case of low leads, we can blame less traffic due to a lack of prioritization of content creation. Implement as many of these 10 reports as possible, depending on where you are at with your business, and remember that it is your job as a marketer to monitor, regardless of the noise.


No Comments Yet
Let us know what you think