For companies looking to scale, it’s important to constantly evaluate operations. In order to track business objectives, company executives need to establish Key Performance Indicators (KPIs), a set of metrics used as a target to bring them closer to their goals.
Evaluating KPIs not only forces organizations to ground themselves in data but drives them to engage in a cycle of continuous improvement. After every marketing campaign, executives can track exactly how their activities impacted their KPIs to help them become more effective over time.
Whether you’re re-evaluating your team’s key metrics, or you’re establishing KPIs for the first time, you need to be able to prepare a KPI report quickly.
Here’s how you can get it done in under 90 minutes.

The Busy Day of a Company Executive
On average, CEOs work about ten hours per weekday and eight hours on weekends, according to a Harvard Business School study. In fact, chief executives tend to work on 70% of their holidays.
Time is a nonrenewable resource, making it the most precious one we have.
As an executive or business owner, you know just how easy it is to lose focus, get distracted, and waste time on tasks that aren’t mission-critical. The best way to overcome this is to give yourself extremely short deadlines and stick to them.
If you’re a perfectionist, it’s almost guaranteed that you’re getting in your own way. Giving yourself deadlines that are shorter than you think they should be will actually help you churn out better results so you can get more out of every day.
That’s why your best bet in preparing KPI reports is to give yourself a deadline of 90 minutes. This will ensure you’re able to stay on top of all of your many tasks throughout the day while staying on top of your organization’s progress.

The Importance of Accurate Reports
Just as important as it is to get your reports done fast, is getting them done accurately.
Without clean data, it’s nearly impossible to use business intelligence to move forward. Too often, corporate data falls short due to inaccuracy and redundancy. This leads to frustrations in the boardroom, causing many to question the validity of KPIs and management reports.
KPIs are commonly compiled by the CFO, sometimes with the help of a software system. Every individual KPI answers a particular question, and the relevancy of each KPI depends on accurate, timely, and complete data.
If you don’t have accurate data, you risk running around in circles and falling short of your company goals. Preparing a KPI report that’s accurate will help you avoid unnecessary detours and frustrations allowing you to get the most out of your reporting efforts.

Preparing an Effective KPI Report
So how exactly do you prepare an effective KPI report? We’ve broken down the KPI reporting process into a few steps to follow along:
Step 1: Narrow Down the Scope of Your KPI Report
Your first step in the process to create a solid KPI report is to be extremely specific about what you’re trying to present. You need to have a clear goal in mind, knowing exactly what you want to accomplish.
Ask yourself the following question to narrow down your report objective:
“I need to show [person/group] how [X] is improving for the purpose of [why].”
For instance: “‘I need to show our investors how our sales are growing for the purpose of securing additional investments.”
Step 2: Choose Your KPI Reporting Style
There are a few ways you could present your KPI report: dashboard-style or table/snapshot style.
Dashboard Style
 A dashboard-style KPI report is focused primarily on the visual impact of your data. KPI reporting dashboards should look clean and professional. They usually include several colorful charts and graphs.
The one downside to dashboard reporting is there’s a limited amount of space due to the charts on the page. If you’re needing to present large volumes of data, you may want to skip the dashboard style. However, if you’re focusing on presenting a few data snapshots and need a great visualization, it’s your best bet.
KPI dashboard reporting works well in the following scenarios:
- Presenting high-level data for a broad overview of your company
- Presenting in-depth data for a specific topic
- Establishing a strong professional presence to impress investors, boards, or public presentations
Table / Snapshot Style
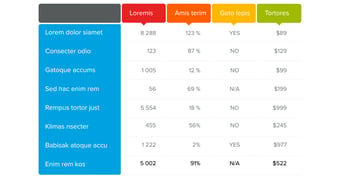
 Another way you can build your KPI reports is with a tabular report or snapshot report. This type of reporting lets you include far more data than the dashboard style. However, this is done at the expense of visuals like charts and graphs.
One downside to tabular reporting is that it’s a bit harder to digest at first glance. However, it actually provides a better overview of data points to give a clearer picture of your progress.
KPI snapshot reporting works well in the following scenarios:
- Presenting deep in-depth data for specific sets of KPIs
- Presenting to those who are very familiar with the subject and value increased data depth
- When your KPIs have several indicators versus a simple “progress” number
While there’s no right or wrong way to present data via a KPI report, it’s important to know your audience so you can make the right reporting decision.
Step 3: Select the KPIs
The next step is to choose what KPIs you want to include in your report. There are nearly endless types of key performance indicators you could choose. It all depends on the type of report you’re creating.
If you’re creating a Finance report, you might want to include gross profit margin, net profit margin, monthly recurring revenue, or return on equity (ROE).
If you’re creating a digital marketing report, you could include cost per lead, traffic, traffic to lead ratio, or ROI by marketing channel.
If you’re reporting on sales, you could include monthly sales growth, quote to close-ratio, sales per rep, or average deal size.
When it comes to how many KPIs to include in your report, it all depends on which type you choose. If you’re creating a dashboard report, try to include 6 or less. If you’re creating a snapshot report, keep KPIs under 20.
Step 4: Add Your Commentary
Most of the time, people get through steps 1 to 3 and finish. But, it’s important to keep in mind that a KPI report isn’t just reporting data. It’s reporting what the data means.
You should always include a commentary section on your report that includes:
- An explanation for major exceptions in specific KPI performance
- Anything that could relate to data integrity being poor or partial
- An action plan to address any KPIs where you’re falling short
KPI commentaries won’t just help the people reading your reports, they’ll also help you to think through the data as you’re creating the report so you can confidently answer any questions when you finally present it.
Boost Your Reporting Strategy With Rizen
As a business owner or executive, you know how tough it can be to get everything done during the week. When it comes to moving your organization forward, KPI reporting is one of the most effective ways to evaluate your progress towards your goals.
However, KPI reporting isn’t always cut and dry. Many executives end up fumbling through stacks of numbers on different sites, while scrambling to come up with something at their next business meeting, only to have it fall flat when it comes time to present.
Instead, by following the steps above, you’ll be able to build, organize, and have a KPI report ready for presentation in under 90 minutes.

If you want to spend less time assembling and more time sharing, Rizen can help you prepare a quick and effective KPI reporting strategy.
Here at Rizen, we’ll get you up to speed with the latest reporting tools and strategies so you can shine when it comes time to present your reports. Plus, as a growth-focused agency, we’ll help you reach your organization's goals in no time.
Are you ready to scale? Reach out to us today!


No Comments Yet
Let us know what you think