
We surveyed 165 college students to collect information on the social media habits of Generation Z (people born between 1995-2015).
The goal of our research was to help other marketers understand how to best use this medium to help businesses grow.
Enjoy this FREE report from your friends at Rizen and subscribe to our monthly email newsletter to receive more exclusive surveys and studies to make smarter marketing and sales decisions.
Which Social Media Platform Does Gen Z Use Most?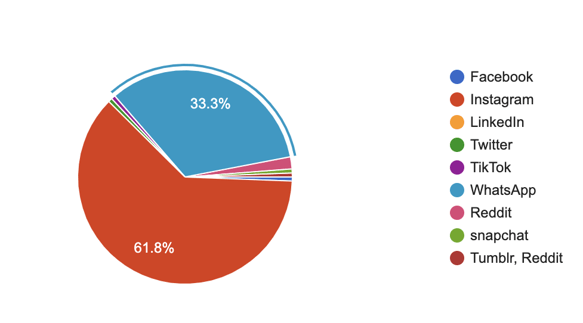
Well-known social media networks such as Facebook and Twitter DID NOT perform well amongst Generation Z, as they preferred more visual, in-the-moment platforms. Instagram overwhelmingly was the most popular, with 61.8% of the top vote. Another Facebook-owned property. WhatsApp, came in second with 33.3%.
Here's the full breakdown of platform popularity:
| 61.8% | |
| 33.3% | |
| Faceboook | 1.8% |
| 0.6% | |
| Snapchat | 0.6% |
| TikTok | 0.6% |
| Tumblr | 0.6% |
| 0.6% |
How Often Does Gen Z Check Their Social Media Accounts?
Seen as an extension of their face-to-face interactions with others, this generation relies on social media to fill in the gaps when friends and family are apart. The overwhelming majority admit to checking their feeds multiple (3 or more) times each day!
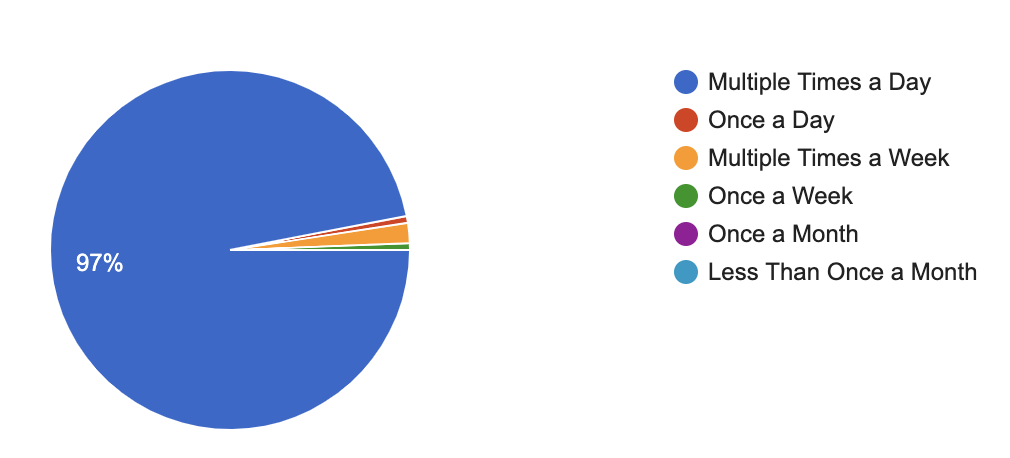
| Multiple Times Per Day (3 or more) | 97% |
| Multiple Times Per Week | 1.8% |
| Once a Day | 0.6% |
| Once a Week | 0.6% |
Interaction Levels of Generation Z on Social Media
It may be one thing to check a newsfeed to see what friends and family are up to, but how many are actively engaging with brands and other people on these platforms?
Again, respondents overwhelmingly stated their time on social media during the day is not passive, with posting, comments, and sharing content being a repeat task throughout the day.
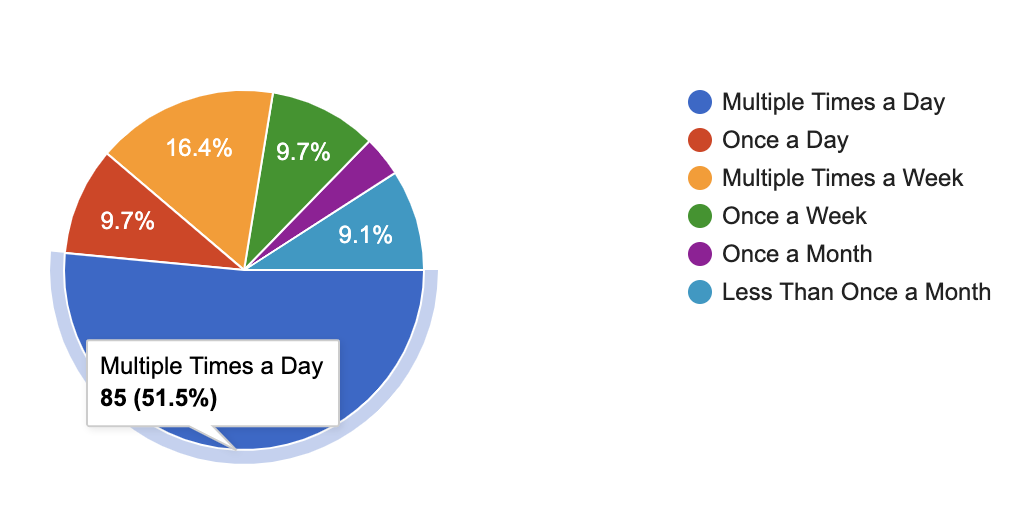
| Multiple Times Per Day | 51.5% |
| Multiple Times Per Week | 16.4% |
| Once a Day | 9.7% |
| Once a Week | 9.7% |
| Less than Once a Month | 9.1% |
| Once a Month | 3.6% |
Product/Service Education From Ads
How effective are your social media ads in educating consumers? Gen Z'ers find this type of content overwhelmingly useful for learning about new brands, as a whopping 95.7% reported they do indeed learn about new brands, products, and services from social media ads.
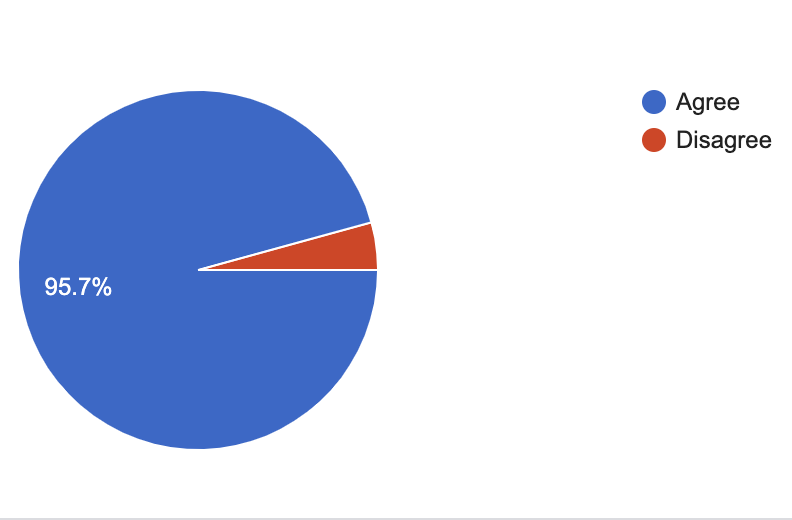
| Agree | 95.7% |
| Disagree | 4.3% |
We asked college students how many times they purchased a product/service because of an ad on social media in the past 12 months.
Ads are effective with Generation Z, as they largest grouping reported purchasing 1-3 products or services in the past year as the result of an ad in their social media feed.
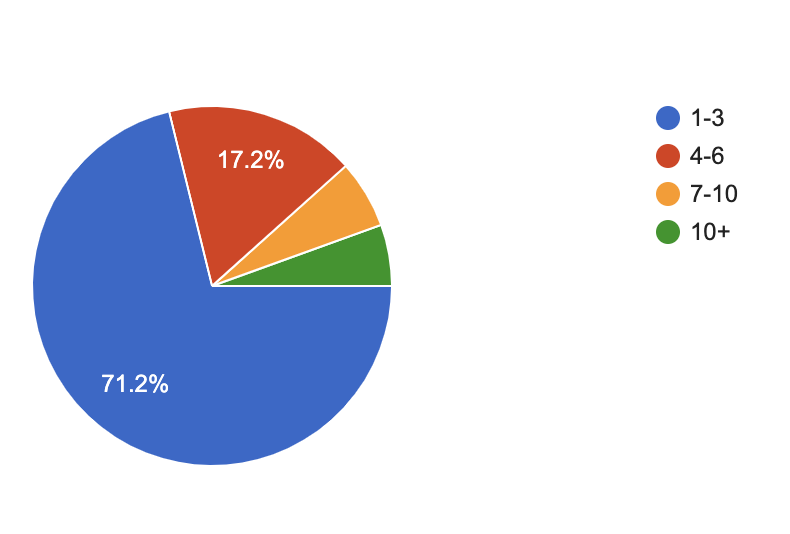
| 1-3 purchases | 71.2% |
| 4-6 purchases | 17.2% |
| 7-10 purchases | 6.1% |
| 10+ purchases | 5.5% |
The Effects of Social Media Influencers & Celebrity Endorsements
We measured how much social media influencers and celebrity endorsements influenced the purchasing decisions of Generation Z'ers. A strong majority reported recommendations from these parties did indeed influence buying habits.
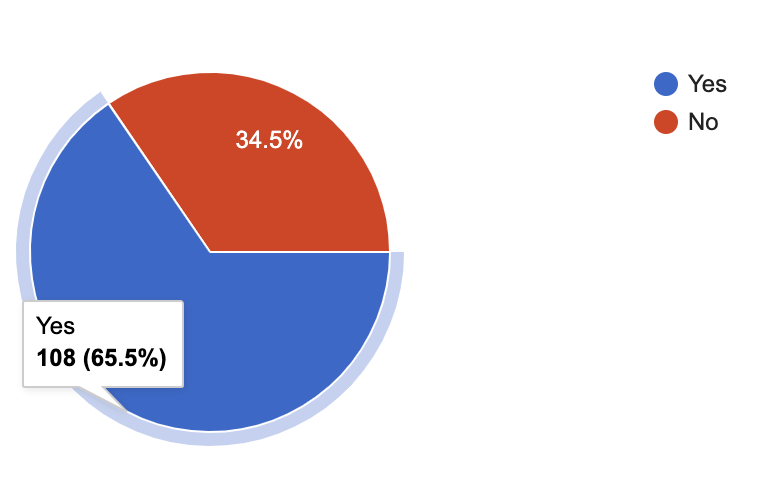
| Yes | 65.5% |
| No | 34.5% |
Sharing Brands and Products on Social Media
The action of sharing brands using social media is less clear-cut, as only a small majority admitted to sharing brands, products, and services other people might enjoy.
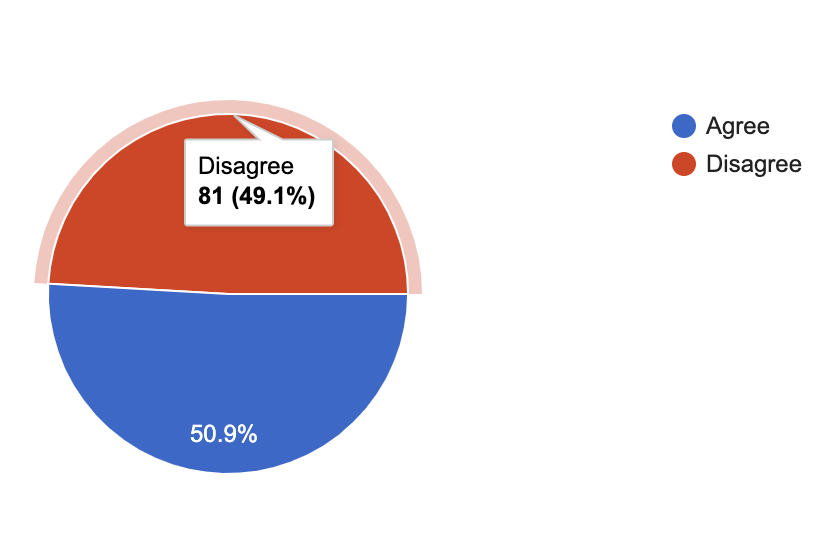
| Agree | 50.9% |
| Disagree | 49.1% |
Social Media Trust Levels Amongst Generation Z
Privacy is a major concern for younger people, as they see the data control technology comes with. While not necessarily in-line with privacy studies, these platforms did the best job of helping users feel secure:
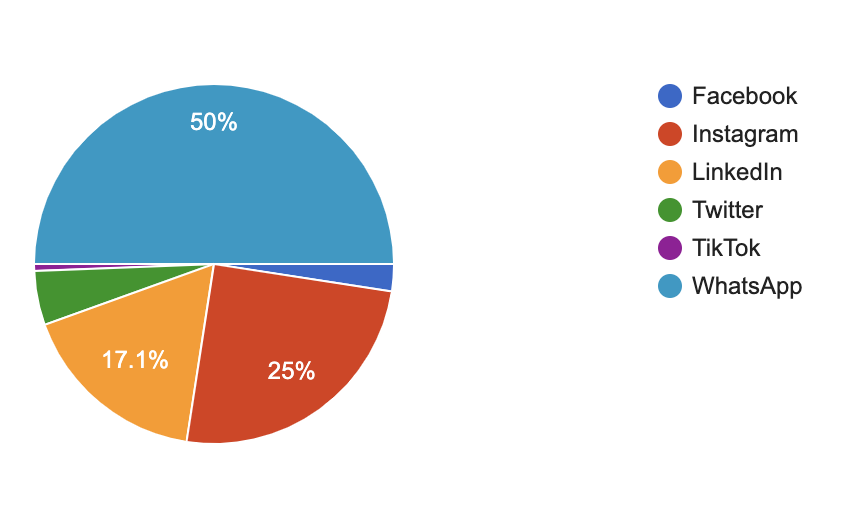
| 50% | |
| 25% | |
| 17.1% | |
| 4.9% | |
| 2.4% | |
| TikTok | 0.6% |
Emerging Social Media Platforms
Each year, social media platforms emerge and fold just as quickly based on user receptiveness. Of all the platforms launched in the past 24 months, TikTok has built the most traction with Gen Z'ers, with 81.5% of respondents reporting they check their account at least once a month.
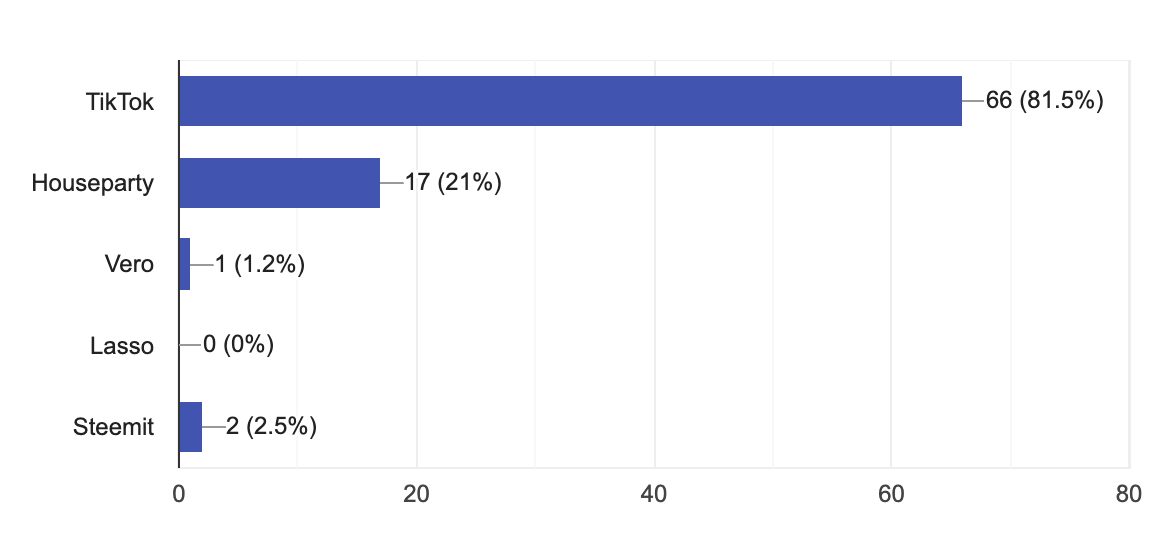
Here's the full breakdown:
| TikTok | 81.5% |
| Houseparty | 21% |
| Steemit | 2.5% |
| Vero | 1.2% |
| Lasso | 0% |
Disconnecting From Social Media
In a previous blog post, we discussed how Generation Z seeks out more opportunities to disconnect from digital devices and enjoy in-person experiences. Our study reflects this same conclusion, as the large majority of respondents reported regular time away from social media was a positive practice.
We measured importance on a scale of 1-5, with "5" showing a regular disconnect as being "most important."
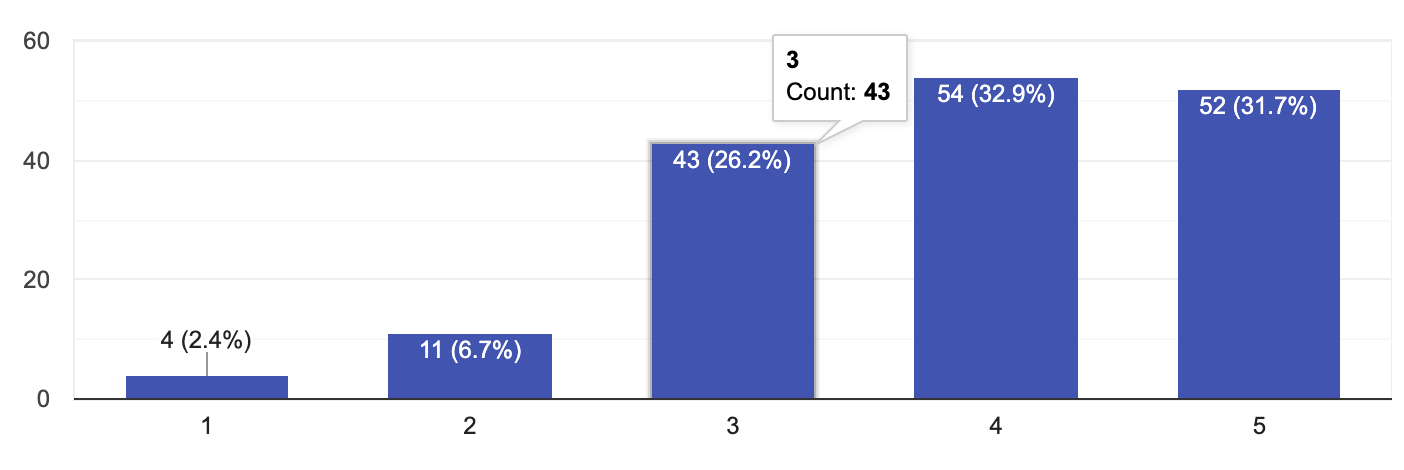
| 5 | 31.7% |
| 4 | 32.9% |
| 3 | 26.2% |
| 2 | 6.7% |
| 1 | 2.4% |

Access More High-Quality Data By Following Rizen
We're committed to providing high-quality, trustworthy data to help you business build smart marketing and selling decisions.
Follow our blog to keep up with monthly survey results and subscribe to our email newsletter.


No Comments Yet
Let us know what you think