.gif?width=1440&name=Data%20Bottom%20of%20funnel%20hero%20(1).gif)
Getting bottom-of-funnel leads to convert to customers should be easy. But irritatingly enough, that is not the case for most businesses. Given the impact of converting this audience on your bottom line, it is crucial to leverage data-driven decision making.
For many marketers, this includes understanding:
- Their unique customer journeys.
- What bottom-of-funnel content should look like.
- Data sources worth tracking at this stage.
Luckily for you, Rizen discusses each of these components in length below.
Why Track Your Marketing Efforts?
Customer purchasing behaviors are continually evolving. Companies have little insight into changing trends without having a process in place for data tracking. As a result, their marketing and customer acquisition strategies become stale and ineffective.
Here are a few stats to support our claims of today’s marketers relying on data-driven decisions.
- 75% of marketers use reporting analytics to show how campaigns are directly impacting revenue. (HubSpot)
- Two in three marketers state data-based choices to be more effective than gut instincts. (Google)
- 32 percent of marketers identified analytics as the most crucial factor in supporting their marketing strategies over the last 18 months. (Gartner)
- Best-in-class marketers are 56% more likely to use data and analytics platforms. (Adobe)
Pro Tip: 👍
The process of data reporting has become commonplace for many marketers. It is the best resource for creating data-driven content that quickly moves quality leads through the sales funnel.
Understanding the Customer Journey
The customer journey contains every event people experience when interacting with your company. Mapping out this process encourages brands to create unique marketing deliverables that correspond with where leads are in their journey. For instance, the type of content created for audiences unaware of brands differs from the content created for blog subscribers.
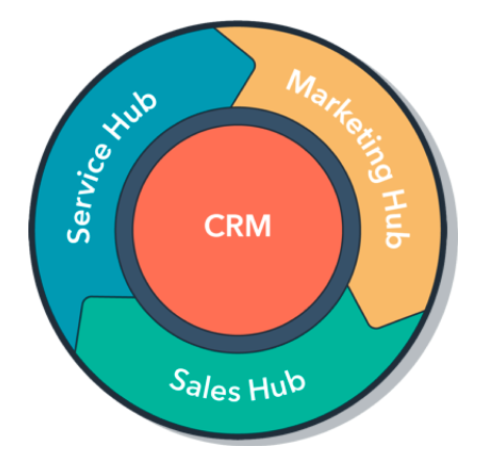
To best organize your customer journey, Rizen recommends following a sales model as a general framework for your content strategy. As opposed to the traditional sales funnel, consider implementing the flywheel model by HubSpot.

The flywheel model is a refreshed way of representing the marketing channels influencing your company’s growth. In short, it reflects how today’s customers interact and work with businesses.
By implementing the flywheel model, organizations emphasize customer satisfaction and retention just as much as acquisition. Why does this benefit you? The probability of converting an existing customer is 60 to 70%. In contrast, the likelihood of converting a new prospect is only 5 to 20%. (Forbes)
Pro Tip: 👍
The conversations you have with someone unaware of your brand is different from those that sign up for a free trial. Make sure you take the same approach when writing and promoting marketing materials.
 What Bottom-of-Funnel Content Should Look Like
When customers reach the bottom-of-funnel stage, they are close to choosing a company to hire or purchase from. Your buyers' questions at this point in the journey are unique to your company's value proposition.
- How do your products or services compare to competitors?
- What outcomes can I expect from using your products or services?
Unlike the top-of-funnel and middle-of-funnel audiences, bottom-of-funnel buyer personas need less thought-leadership pieces and more logistical type content.
Here are a few examples of what your bottom-of-funnel content strategy should look like:
1) Success Stories
Customer case studies combine the engaging components of storytelling with the power of data and evidence.
2) Live Demos
Offer prospects personalized demonstrations of your products or services. For instance, schedule a 30-minute video call where you share your screen. Take this time to showcase elements of your product that relate to the buyers’ unique challenges.
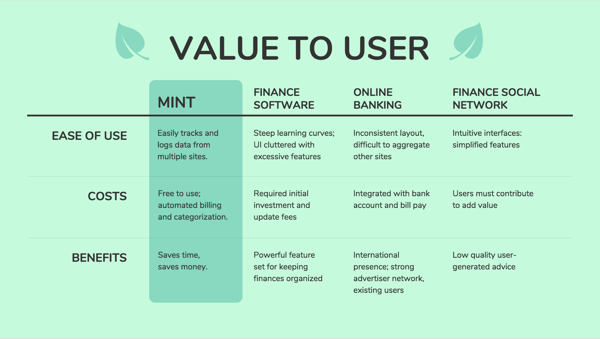
3) Competitor Comparison Cards
A comparison chart is an easily digestible graphic that highlights your business's strengths and weaknesses to industry peers.
Below is an excellent example of a competitor compare card. (Venage)

Pro Tip: 👍
Bottom-of-funnel content should give prospects a friendly nudge towards becoming your customer. Content should clearly show the value your products or services provide over competitors.
Data Worth Tracking
Once you have set up a content strategy for bottom-of-funnel audiences, it’s essential to understand what data is worth tracking. These analytics help decide where your time, money, and resources are best invested.
Here are three data sources Rizen finds most beneficial at this point in the customer journey for more context.
1) Time to Conversion
This data source identifies how long it takes people who visit your website to complete the desired goal. Common types of conversions are site visitors making a purchase or filling out a contact form.
Tracking this metric tells marketers how long they can expect a bottom-of-funnel lead to convert to a customer. It predicts what new business you potentially have in the pipeline so you can readjust your resources accordingly.
2) Lead Attrition
Lead attribution assigns credit to a marketing touchpoint of each stage in the customer journey. Tracking this data source allows marketers to understand which efforts provide the most qualified leads.
This metric is beneficial for organizations executing multiple marketing strategies such as PPC, display ads, SEO, and more. Lead attribution signals which of these channels create conversions. With this insight, marketers can infuse those campaigns with the most significant spend and calls to action.

This metric shows the revenue a company can realistically anticipate from one customer account throughout their relationship.
Many marketers choose to measure their CLV because it fuels future decision making. It helps answer critical business questions such as:
- Who is your most profitable type of customer?
- What kind of products or services do these audiences want?
- How much money do you have to spend to acquire a similar type of customer?
It is no wonder why 76% of companies see CLV as an essential concept for their organization (Invesp).
Pro Tip: 👍
For those interested in calculating their CLV, HubSpot offers an easy-to-use Customer Service Metrics Calculator. Download for free here.
Data is only as powerful as how we present it. Learn more about useful data reporting with these resources:
- How to Present Marketing Data Your Boss Will Understand
- Effective Data Reporting Requires Storytelling. Here’s Where to Start.
 Make Data Reporting a Priority This Year
There once was a time where marketers built campaigns solely on gut instincts and traditional best practices. While these still have a role in today’s execution strategies, data should be the primary source driving decision-making.
Building a data-driven marketing strategy allows companies to:
- Make more confident decisions.
- Become more agile and proactive.
- Identify new opportunities and revenue of growth.
For years, experts have predicted data analytics to become progressively more important for successful businesses. If you haven’t already, create a plan to make reporting a priority this year. You won’t regret it.


.gif)


No Comments Yet
Let us know what you think